Information graphics or infographics are graphic visual representations of information,data or knowledge intended to present complex information quickly and clearly.They can be improved by utilizing graphics to enhance the human visual system's ability to see patterns and trends.
 Visualization is any technique for creating images ,diagrams ,or animation to communicate a message.visualization through visual imagery has been an effective way to communicate.
1. Easel.ly
Easel.ly is another
free web-based tool for creating infographics. You cannot create graphs using
real data with this tool, but its really good for conceptual visualizations. It has a beautiful user interface and the themes
you can start with are gorgeous. This tool has the best selection of well design objects and backgrounds that I've seen throughout this list of
tools. Additionally, you can upload your own images with the free version.
2. Infogr.am
Infogr.am is another free, web-based tool with some really nice
themes and a great interface for creating simple infographics. This option also
allows you to create charts using real data. There are 31 chart options
that offer some really cool displays, like a radial bar graph, scatter charts,
bubble graphs, and map charts. You can also add your own images and video. When you're done creating
your infographic, you can embed it on a website and publish it to the
infogra.am site
3. Piktochart
Piktochart is a web-based tool that has six decent free themes (and many more for the paid version) for
creating simple visualizations. You can drag and drop different shapes and
images, and there is quite a bit of customization available. You can also add
simple line, bar, and pie charts using data from CSV (or manual entry). You can
export to PNG and JPG in either print or web quality.
4. Tableau
Tableau has some free tools for creating data visualization. It is not a web based tool ,so we can easyly download this software.once u download the software ,you can easyly upload a spreadsheet or CSV and create a variety of interactive data visualizations types which includes heat maps, Vann diagrams bar charts ,line graphs and others.
NOTE:- THIS TOOL IS ONLY FOR WINDOWS.
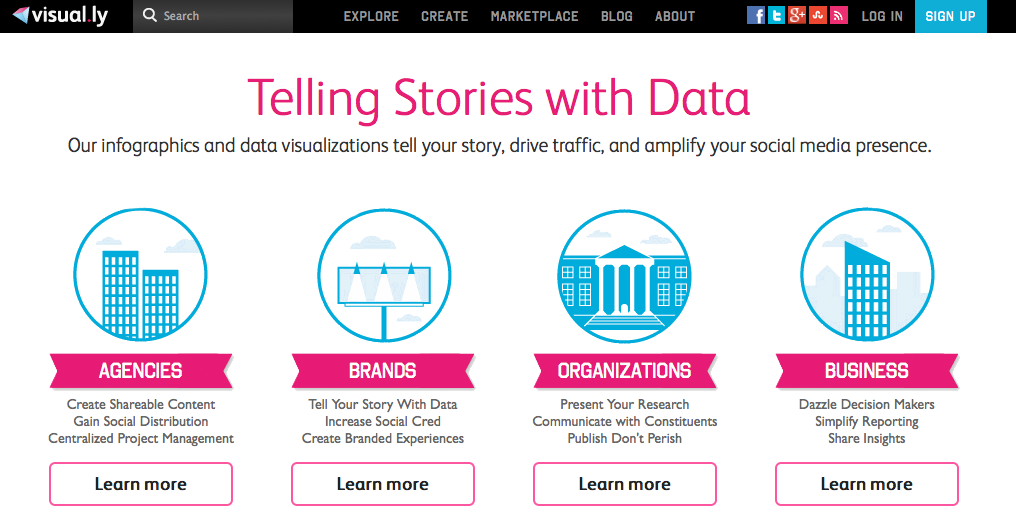
5. Visual.ly
Visual.ly has some simple free tools worth
mentioning, many of which integrate with social networks to analyze Twitter and
Facebook data. You can create fun Venn diagrams, Twitter account show-downs,
visuals that analyze hash tags, and a few others, but there's almost no
customization available.

#You have to risk it ,to get the biscuit..
Kindly Bookmark this Post using your favorite Bookmarking service:


Post a Comment
Note: only a member of this blog may post a comment.